How we found a TCP hangup regression between AWS ELBs and Node.js
A Node.js security patch for the SlowLoris vulnerability causes many AWS ELBs in their default configuration to throw 504 errors.
In late November, our users reported seeing 504 errors a couple times a day while using one of the websites my team maintains at 2U. There was no pattern to the errors. They were happening for static assets, api routes, proxied routes, and your authentication status did not matter.
Initial Diagnosing
We immediately turned to networking for debugging, as the pattern described an intermittent networking issue, not a chronic code-related issue which would have been reported by our server monitoring. Two observations were made that led us immediately to networking.
The first observation was that the issue was intermittent and was a 504 error. AWS returns 504 errors from the ELB for a few reasons that can be found here.
- The application takes longer to respond than the configured idle timeout
We knew that this wasn't the issue we were experiencing, as the errors were happening instantly, not after 60 seconds which is the default idle timeout for ELBs. - Registered instances closing the connection to Elastic Load Balancing
This option was the most likely culprit, as option 1 was not plausible due to the characteristics of the error.
Observation number two was that our automated server monitoring wasn't reporting any errors being thrown, nor was it registering any response time spikes, which indicated a failure occurring in the request prior to it reaching our server.
Attempts to reproduce this bug on our staging stack proved fruitless, even though we run the exact same configuration in staging just with smaller database instances. This was unfortunate, because it meant that prod was the only place that the issue was reliably occurring, and we had no reliable reproduction steps other than "wait until business hours when people are online."
A Little About Our Stack
At this point, I would like to describe our software stack a little bit to provide clarity on the systems and infrastructure we are working with. Our primary web servers were running Node.js 8.14.0 (Carbon LTS) at the time and using hapi.js v16 as our web framework of choice. Both of these systems have been well proven in production environments around the world. Our application runs on a 70 node Kubernetes cluster that we maintain in-house, using flanneld for networking and running in an 8 replica configuration. We sit behind an AWS ELB that is stood up by a Kubernetes Service, and then registered as an A ALIAS record within Route53 for our primary domain. The site is also accessible via a Cloudfront behavior on all of our partner websites.
Deep Dive
We pulled up our Grafana charts which are fed from a combination of NewRelic, AWS Cloudwatch, and our Kubernetes monitoring.
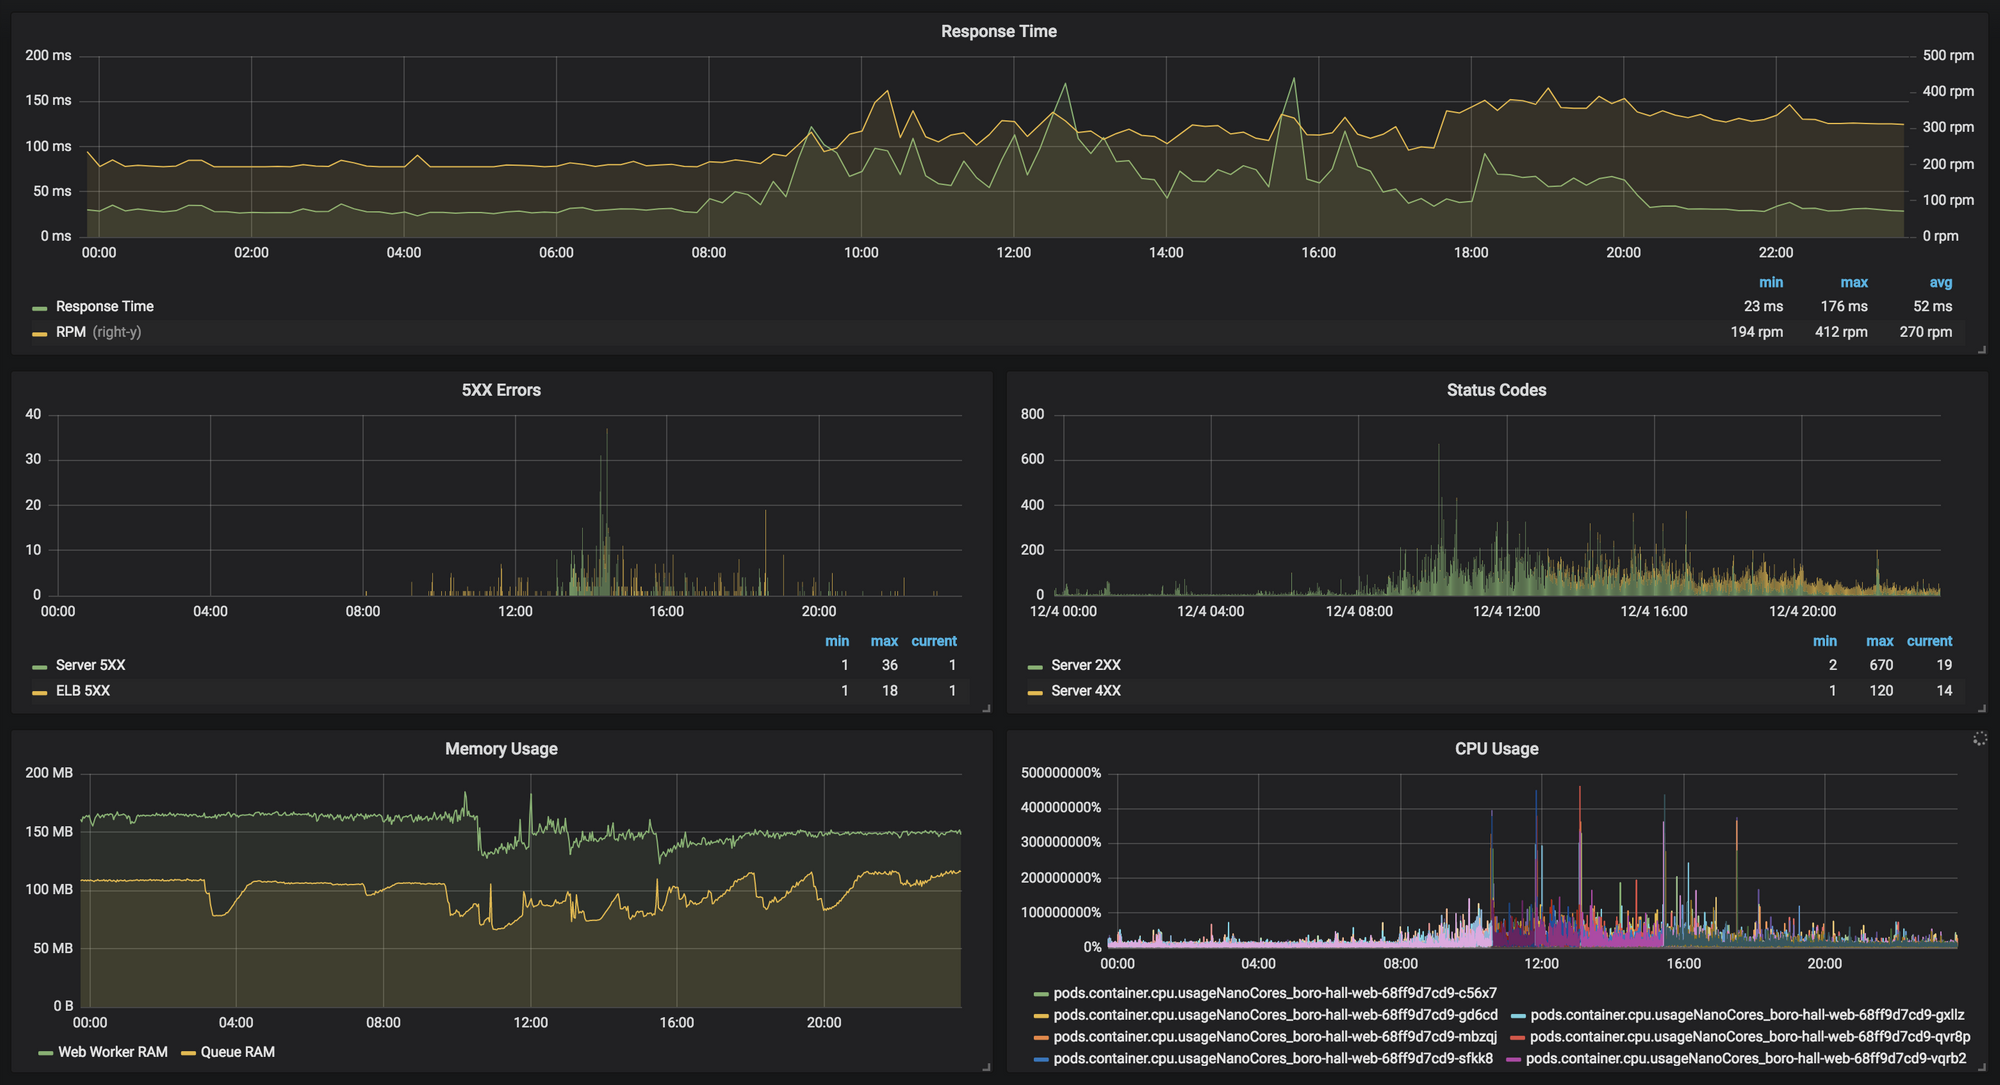
As can be seen in the above chart, around 8am in the morning we logged our first ELB 5XX error, and they continued to happen at low levels throughout the day. The spike in Server 5XX is unrelated and was due to an outage of an internal service that backs ours. Response time reported by NewRelic stayed within healthy ranges, and there were not any spikes in response time. Memory and CPU usage were also within acceptable ranges over the duration of the day.
We also had reports from users stating that accessing our site via the Cloudfront behavior was resulting in more errors than accessing it via the partner-agnostic domain, which was an interesting anecdote. When looking through our Cloudfront terraform configuration, I noticed that we were setting error_caching_min_ttl=5 on our error caching configurations. Due to how caching was configured for our service, if one user got an error on a common route like /api/me, all users fetching that route would receive an error for 5 seconds. This explained the prevalence of errors on Cloudfront-based access but not the root cause.
After ruling out CPU and Memory usage as root causes and resolving the heightened error rate when behind Cloudfront, we then began digging into ELB access logs. In our ELB access logs, we found that all of the affected requests had signatures that looked like the following snippet:
2018-12-04T21:46:54.679150Z afd9255985c5d11e79f700a6e669848f 111.222.333.444:55555 - -1 -1 -1 504 0 0 0
Based on the published ELB access log format, we noticed our first clue. Our logs were showing the source IP address and port, but not the destination IP address and port, instead outputting a single hyphen which can mean two things:
If the load balancer can't send the request to a registered instance, or if the instance closes the connection before a response can be sent, this value is set to
-.
This value can also be set to-if the registered instance does not respond before the idle timeout.
Based on the prior information discussed, we were able to immediately rule out the timeout option, which means that the ELB was somehow unable to send a request to our instances, or that our instances were closing the connection before responding. At this point we decided to try to recreate the issue within our Kubernetes infrastructure behind the ELB, because it seemed like something in the Kubernetes networking may have been affecting the request reaching our servers as none of our server access logs showed the requests reaching their destination pods.
Based on our limited knowledge of Kubernetes networking and the research that we had just done, we hypothesized that our requests were failing at one of the following points:
- ELB never hits the Kubernetes Node's IP
- Kubernetes Node refuses request
- Kubernetes Node gets request, but fails connecting to Cluster (Service) IP
- Cluster IP fails connecting to a Pod IP
- Request is passed to the Pod, but Pod fails to respond
We proceeded to write an incredibly rude Node.js script that hit every application entry point once per second. We were running a ~70 node cluster at the time, and our script ended up hitting our application an additional 4000 times per minute, because a Kubernetes deployment using an ELB-backed Service can be hit via the Pod IP addresses, Cluster IP address, and Node IP addresses. I embedded the script used below, feel free to scroll past if you want to skip how we used the Kubernetes internal API to make a list of all of our entry points.
This script hits our applications /api/health route which triggers the full hapi.js request lifecycle (pdf) as well as hits to both our database and cache to check connectivity.
We ran the script as a separate deployment in our Kubernetes cluster because the cluster has `fluentd` set up to tag and send all logs to our log manager, which makes querying much simpler.
Unfortunately, deploying this to our staging cluster and turning on all of the options resulted in zero errors over a one hour period at a sustained 4000rpm. This meant we still had no way to test this on staging, and production was our next testing target 😱.
We examined our staging server metrics during the load test, and determined that the staging cluster was able to handle the bursted traffic without an issue. This gave us confidence in our ability to run the tests on production during business hours using the gradual scale up allowed for by our script. Here is our monitoring during the test, showing the steadily increasing requests per minute and the 504 occurrence.
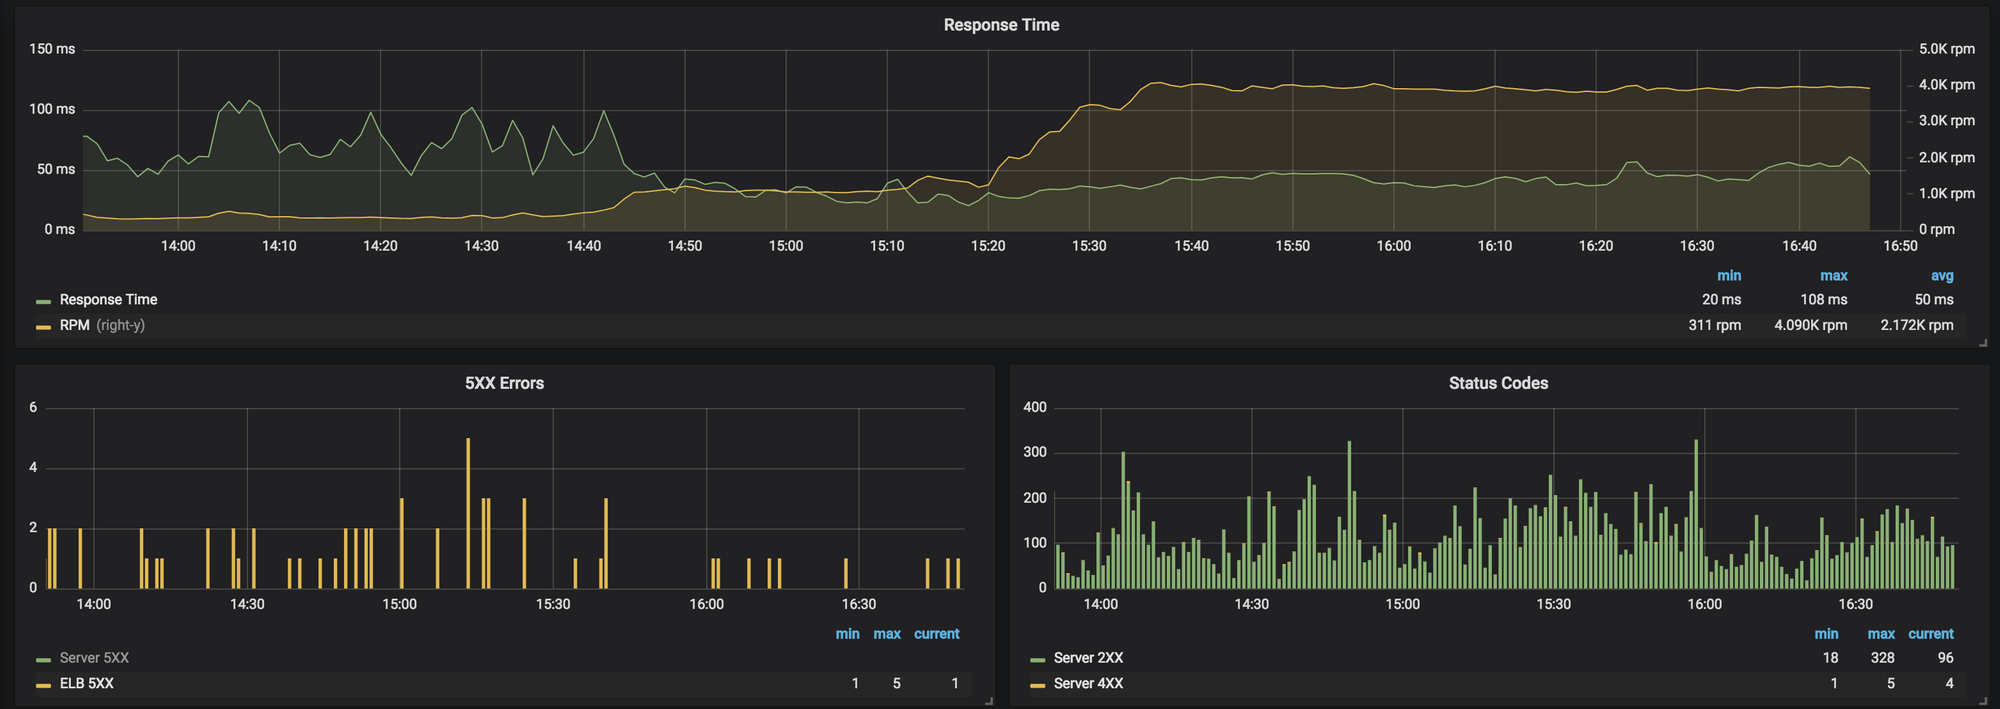
Despite the 15x increase in traffic, the rate of 504 errors did not increase, none of the added requests logged an error to our log management system, and the application stayed completely healthy. No new leads.
On the bright side, we knew that it was unlikely that the issue was specific to the Kubernetes networking layer.
Next, we installed tcpdump on a sidecar container in our pods, and started inspecting all of the traffic. Since we still could not reproduce in staging, this was a lot of data coming in a very short period of time, and it was nearly impossible to search through by hand. One of my teammates created a script that scanned all of the pcap files for request/response imbalances to help us narrow down the playing field. The script used was as follows:
After my teammates valiantly sorted through 500MB of tcp logs, they located the following packet sequence that resulted in a request/response imbalance:

This shows our servers ACKing a request to /auth/sessions, but then immediately sending a RST, ACK (connection reset) packet as a response to the same frame. This would result in the exact behavior that we were seeing, which is an ELB instantly 504ing to a request due to a TCP hangup. This request was the first request over the opened socket, and occurred ~43 seconds after the socket had been originally opened. This was strange, as none of our idle connection timeouts or any timeouts we could find documentation for were in the 40 second ballpark.
When we initially set up our application using Node.js, hapi.js, and an ELB, the ELB Idle Connection Timeout was set to 60 seconds (default) and Node.js/hapi.js were configured to sockets to remain open for up to 2 minutes (default). This was in line with the recommended configurations for ELBs where the ELB idle timeout is lower than the application idle timeout, and failed to explain the RST above
After some additional Googling, we discovered this post which describes an undocumented behavior of an ELB where it will open a connection early, and then do nothing with it until a client makes a request at which point the ELB starts sending the request to the pre-established connection. This is an interesting behavior because the ELB is essentially opening a TCP socket but not sending any data over it. Definitely worth testing to see if this was the cause of our issues.
We then wrote an additional Node.js script that used the net built in library to open a socket connection, listen for all emitted events, send an HTTP request after a delay, and log the response. We configured the script to test sockets that had been opened but left idle for 29, 31, 39, 41, 49, 51, 59, and 61 seconds. These values were chosen because we wanted to run a test on either side of possible timeout boundaries, which were generally multiples of 10.
When we ran this script against one of our public ELB IP addresses, we saw no strange behavior which confirmed that the ELB was acting as it was supposed to. Running the script against our Pods in the Kubernetes cluster had much more interesting results.
Tests with delays of 29, 31, and 39 all passed with flying colors. We sent our request, and we got back a proper HTTP response. The requests using a 41 and above delay failed. Immediately after we sent the HTTP request on a 41 second delay, we got back a message that the server had closed the connection. This was interesting, because we had tested this when our server was initially created and understood that the HTTP socket timeout was 2 minutes and it still is.
Understanding that our servers were timing out sockets after 40 seconds led us to immediately drop our ELB Idle Connection Timeout to 35 seconds to restore the recommended configuration of ELB Timeout < Application Timeout. This immediately alleviated the 504s that we were seeing from our monitoring and users reported not receiving them anymore either.
Since the immediate issue had been resolved, I created a reproduction repo and opened a bug in the Node core repo. It turns out this type of connection is described by the SlowLoris DoS attack as potentially being used by attackers to exhaust resources by opening sockets and then not using them.
Node.js core patched this via this commit, which was introduced on Aug 23, 2018, which is just before we started seeing an increase in 504 errors. Our build process automatically picked this up as it was published as part of the carbon LTS release line of Node.js, even though it was a potential breaking change. This patch terminates any sockets that are opened but headers are not sent across within 40 seconds of the socket opening. This works terribly with the ELB connection pre-warming because the ELB is intentionally not sending headers over the socket when it opens it.
I am sure that this issue has affected more than just me and my team at 2U, as a seemingly benign security patch wound up causing intermittent 504 errors when running behind an AWS ELB due to how the connections are pre-warmed. We have seen something similar affect our Apache based servers as well, and applied a similar change to the ELB Idle Connection Timeout to resolve the issue there as well.
I proposed increasing the headers timeout in Node.js from 40 to 60 seconds to maintain compatibility with AWS ELB default configurations, but so far there hasn't been any real movement on the opened issue other than it being assigned to someone. Another possible fix for the issue would be to allow for disabling of this feature, as our connections from the ELB can be considered trusted, and we likely do not need to handle the SlowLoris attack behind the ELB, as the ELB does not forward the request to the back end server until it has received the entire request.
Hopefully this post can help provide some insight for other people experiencing strange immediate 504 connection errors from their AWS ELB when their back end service is fully healthy!